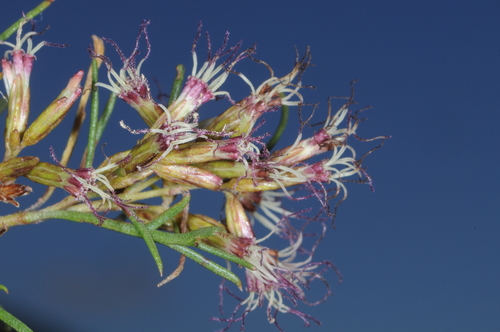
Acanthostyles buniifolius (Hook. & Arn.) R.M.King & H.Rob.
Also called Eupatorium buniifolium, Eupatorium buniifolium var. bakeri, and 8 more.
| Family | Asteraceae |
|---|---|
| Native to | Bolivia, Brazil South, Argentina Northeast, Argentina Northwest, Uruguay · Kew's World Checklist, file of 2026-06-04 |
| Your plants | Add one · related species |
Asteraceae · Bolivia +4
Family Asteraceae
Native to Bolivia, Brazil South, Argentina Northeast, Argentina Northwest, Uruguay
Habitat in shortFigures ›
- Cold floor
- 0.5 °C 1 night in 100 colder NASA POWER
- Rain
- 1,159 mm a year, median across the range CHELSA
- Open-sky light
- 14–47 DLI lowest to highest month CHELSA
- Season
- Rain spread over eight months or more CHELSA


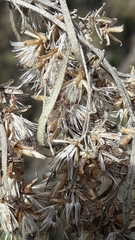
 66 photographs ›
At a glance
- Jan
- Feb
- Mar
- Apr
- May
- Jun
- Jul
- Aug
- Sep
- Oct
- Nov
- Dec
Hardiness of the habitat
| USDA zone of the habitat | 10a | the mean of the typical spot’s lowest night in each of 44 complete years, 1981–2024: −0.6 °C = −0.6 × 9 ÷ 5 + 32 = 30.92 °F, in zone 10a (30 to 35 °F). USDA’s zones are the 30-year mean of each year’s lowest temperature, in 10 °F zones with 5 °F half-zones (USDA Plant Hardiness Zone Map); this mean is of the years the series holds, not USDA’s 1991–2020. |
|---|---|---|
| RHS band of the record low | H3 | the record low falls in RHS’s H3 band (−5 to 1 °C: half-hardy, unheated glasshouse or mild winter; RHS hardiness rating): −2.5 °C, the lowest night in 44 years. |
Both are the habitat’s, worked out from where it grows wild: neither is a tested hardiness of the plant. Lows from NASA POWER (MERRA-2) daily 1981–2024, cell -34.50_-55.000, lapse-corrected -28 m at 6.5 °C/km.
Climate class
Cfa Köppen–Geiger, worked out from the median year of the range’s 272 cells
| C temperate | the coldest month 9.9 °C, over 0 and under 18 °C; the warmest 22.6 °C, over 10 °C; not arid: 1099 mm a year, 10 × 46.6 mm (2 × 16.3 + 14: 59% of the rain in summer and 41% in winter, neither 70% or more) or more |
|---|---|
| f without dry season | neither: the driest summer month 95 mm against the wettest winter month's 102 mm, the driest winter month 58 mm against the wettest summer month's 115 mm (summer October to March) |
| a hot summer | the warmest month 22.6 °C, 22 °C or more |
By the thresholds of Peel, Finlayson and McMahon (2007), Hydrology and Earth System Sciences 11, 1633–1644, Table 1; summer is the warmer of October to March and April to September. The class of the median year, each month’s median across the cells, not of each cell.
Walter–Lieth: no arid month: every month’s rain in mm is at least twice its mean temperature in °C. The scale of Walter and Lieth’s climate diagrams (1960–1967), 10 °C to 20 mm.
The months read: CHELSA V2.1 1981–2010 climatology, 0.05° cells (each the mean of ~36 1 km pixels).
At home, aim for (worked out from the figures above)
| Winter nights | -1–8 °C | the July mean nightly low, 10th to 90th percentile across the 272 cells of the range, median 6.5 °C (CHELSA V2.1, 1981–2010); its coldest night on record was -2.5 °C (NASA POWER, daily lows over 44 years at the typical spot) |
|---|---|---|
| Summer days | 22–30 °C | the January mean daily high, 10th to 90th percentile across the 272 cells of the range, median 27.1 °C (CHELSA V2.1, 1981–2010) |
| Grow light, 14 h a day | 601 µmol/m²/s | the year’s mean daily light, 30.3 mol/m²/day (the twelve monthly medians averaged; open sky, CHELSA V2.1, 1981–2010 solar radiation at 2.07 mol of PAR per MJ), × 1,000,000 ÷ (14 × 3,600) |
| Humidity | 57–63% | the lowest and highest of the twelve monthly median relative humidities (CHELSA V2.1, 1981–2010); a figure about the air, saying nothing of how the plant takes water |
A starting point worked out from where it grows wild, not tested in cultivation. The light is the open sky’s; a plant among rocks or shrubs gets less.
About the genus · Acanthostyles
Acanthostyles is a genus of flowering plants in the family Asteraceae described as a genus in 1971.
Quoted from Wikipedia, "Acanthostyles", its opening paragraph, revision 1364818492, read 2026-11-08, CC BY-SA 4.0.
Cultivation
Seasons
The rain rule reads no short rainy season: 70% of the median year's rain (839 mm of 1,099 mm) takes 8 months, October to May. Mean temperature moves 12.7 °C between the warmest and coldest month. Months are the habitat's, southern hemisphere; shifted six months for a northern-hemisphere collection: April to November.
Rain
1,099 mm in the median year at the habitat, 839 mm of it October to May. Wettest months (2 at 115 mm), driest month July at 58 mm. Across the grid cells of the range the year's total runs 389 mm to 1,366 mm, the 10th to 90th percentile of each cell's own year. The median of the cells' own yearly totals, 1,159 mm, is the year's rain at the top of the page; the 1,099 mm here is the median year's, the twelve monthly medians added, which the rain rule reads. Habitat calendar, southern hemisphere; median year across the grid cells of the range, CHELSA.
Light
Open sky over the habitat: 14 to 47 mol/m²/day across the year (daily light integral, median year across the grid cells of the range, CHELSA; the lowest 10th-percentile month across the cells is 13, the highest 90th-percentile month 52).
Warmth and air
Coldest: the 1st-percentile night over 44 years at a typical spot in the range is 0.5 °C, the absolute minimum -2.5 °C, 99 frost nights in 44 years, 2.3 a year (NASA POWER daily minima). Warmest: the 99th-percentile day is 35.6 °C. Monthly means: the coldest month's mean nightly low 6.5 °C in July (across the grid cells of the range -1.4 °C to 8.4 °C), the warmest month's mean daily high 27.1 °C in January (median year across the grid cells of the range, CHELSA). Cold floor: 0.5 °C, which is the 1st-percentile night over 44 years at a typical spot in the range (NASA POWER).
Relative humidity at the habitat: 57 to 63% across the year (monthly means, median year across the grid cells of the range, CHELSA). A figure about the air, saying nothing about how the plant takes water.
How this section is made
Each card states this species' habitat figures with their sources, and what two fixed rules read from them; nothing here says what the plant does, wants or tolerates. The rules · the terms.
Seasons. Read from the median year of CHELSA monthly rainfall and mean temperature across the grid cells of the range: the rain rule takes the smallest set of months carrying 70% of the rain and calls it winter when its mean is more than half a degree below the year's, summer when more than that above, and neither in between; the temperature rule, used only under 120 mm, names the cooler six months when they are at least a degree cooler than the other six. Months are shifted for the other hemisphere only where the temperature curve moves 4 °C or more and the habitat lies 10° or more from the equator. A reading of the curves, not an observation of the plant.
Rain. CHELSA monthly precipitation, median year across the grid cells of the range. The rain that falls where the species is recorded; nothing about how the plant takes water.
Light. CHELSA shortwave radiation at each envelope cell, a daily-mean flux taken to a daily total and converted at 2.07 mol of PAR per MJ. The sky over the habitat, measured; what reaches a plant under a rock, a shrub or a shade cloth is not.
Temperature. NASA POWER daily minima and maxima over 44 years at a typical spot in the range, lapse-corrected -28 m to its elevation; CHELSA monthly means, median year across the grid cells of the range. The cold floor is the 1st-percentile night named in its sentence. Not a measured survival limit for any plant in a pot.
Humidity. CHELSA relative humidity, median year across the grid cells of the range.
Climate across the habitat
Habitat months, southern hemisphere
Mean daily high from 14 °C in Jul to 27 °C in Jan; mean nightly low from 7 °C in Jun and Jul to 18 °C in Jan and Feb. The cold quarter, May to Jul, is the three months around the coldest month's mean nightly low, centred on the 2 months in a row that tie for it. 1,099 mm of rain in the median year (the twelve monthly medians added), the wettest months (2 at 115 mm). The bands show the 10th to 90th percentile across 272 habitat cells. Over 44 years at a typical spot in the range (NASA POWER) the absolute minimum was -2.5 °C and the 1-in-100 hot day (the 99th-percentile day) 35.6 °C; neither is dated to a month. Beneath: daily light integral and relative humidity through the year, each on its own scale.
Figures by month
| Month | Day °C | Night °C | Rain mm | DLI | RH % |
|---|---|---|---|---|---|
| Jan | 27 / 22–30 | 18 / 12–20 | 105 / 64–181 | 46 / 43–50 | 57 / 54–61 |
| Feb | 26 / 21–28 | 18 / 12–19 | 115 / 61–149 | 39 / 37–44 | 59 / 56–62 |
| Mar | 24 / 20–27 | 16 / 10–18 | 115 / 48–149 | 32 / 31–35 | 60 / 58–63 |
| Apr | 21 / 16–23 | 13 / 7–15 | 102 / 27–140 | 23 / 22–29 | 61 / 58–63 |
| May | 17 / 13–19 | 10 / 3–12 | 93 / 16–123 | 18 / 17–23 | 62 / 55–64 |
| Jun | 15 / 10–16 | 7 / 0–9 | 67 / 7–108 | 14 / 13–20 | 63 / 52–65 |
| Jul | 14 / 9–16 | 7 / −1–8 | 58 / 14–106 | 16 / 15–22 | 62 / 51–64 |
| Aug | 16 / 12–18 | 8 / 0–9 | 59 / 11–98 | 21 / 20–28 | 60 / 51–63 |
| Sep | 17 / 14–20 | 9 / 1–10 | 76 / 17–98 | 29 / 27–36 | 60 / 52–63 |
| Oct | 21 / 17–23 | 11 / 6–13 | 108 / 20–126 | 36 / 35–44 | 59 / 52–62 |
| Nov | 23 / 20–26 | 14 / 8–16 | 106 / 30–137 | 43 / 42–50 | 58 / 52–61 |
| Dec | 26 / 22–29 | 16 / 11–18 | 95 / 46–172 | 47 / 44–52 | 57 / 53–60 |
How this section is made
Natural habitat
Flowering by month
- 1Jan
- 2Feb
- 7Mar
- 3Apr
- 0May
- 0Jun
- 0Jul
- 0Aug
- 0Sep
- 0Oct
- 0Nov
- 0Dec
Flowering observations of wild plants on iNaturalist, as iNaturalist shares them with GBIF: GBIF.org (2026-11-15) GBIF Occurrence Download https://doi.org/10.15468/dl.y8zpkp: 13 observations, research grade, openly licensed (CC0, CC BY or CC BY-NC), counted under the page's GBIF keys. Calendar months, as each plant was observed; not moved to your hemisphere. The habitat lies south of the equator, where these months fall in the other season.
How this section is made
Photographs
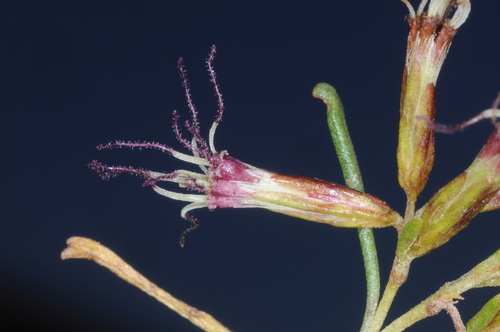
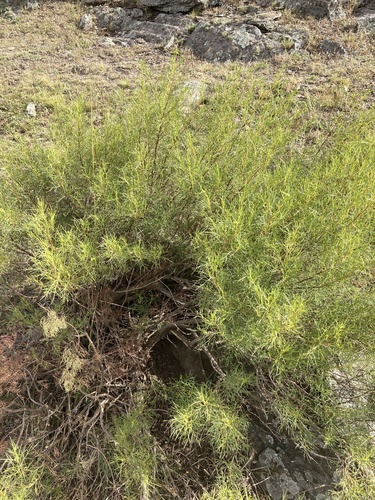
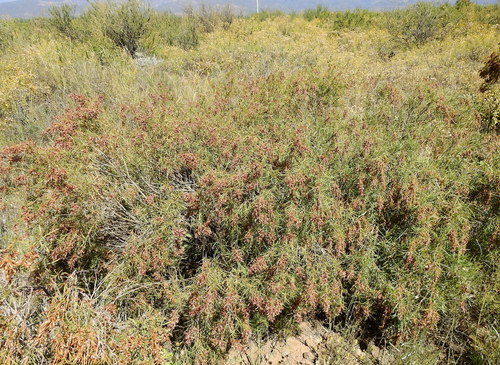
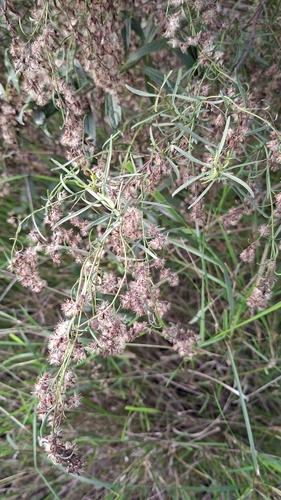
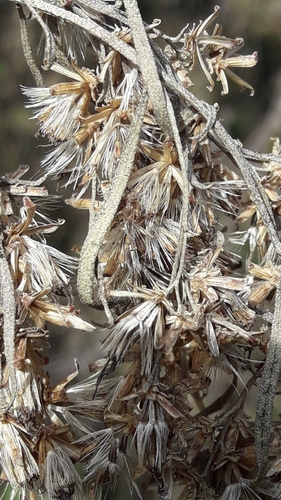
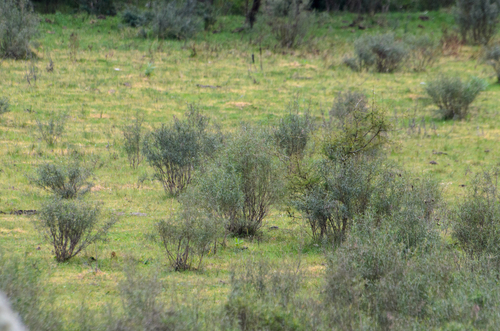
The photograph at the top: (c) aacocucci, some rights reserved (CC BY), observed growing wild, observed 2019-04-19. Photographs: (c) aacocucci, some rights reserved (CC BY); (c) Facundo Chieffo, some rights reserved (CC BY); (c) Guillermo Debandi, some rights reserved (CC BY); (c) Agustina Collazo, some rights reserved (CC BY); Analía Belaus, no rights reserved (CC0); (c) Pablo G. Fernández-Santiago, some rights reserved (CC BY). Credits as read from iNaturalist on 2026-11-04. What each licence allows.
Related
Similar habitat climate The 6 nearest by mean daily high, mean nightly low and rain, month by month. How.
 Lathyrus pubescens Fabaceae Photo: CC BY, Lauu
 Pfaffia gnaphalioides Amaranthaceae Photo: CC0, Hugo Hulsberg
 Modiola caroliniana Bristly-fruited Mallow Photo: CC BY, Sam Kieschnick
 Paspalum quadrifarium Tussock paspalum Photo: CC0, Diego Carús
 Baccharis articulata Asteraceae Photo: CC BY, Ezequiel Vera
 Araujia sericifera Bladderflower Photo: CC BY, Joan Simon
Names & registers
Also known as Eupatorium buniifolium; Eupatorium buniifolium var. bakeri; Eupatorium buniifolium var. hieronymi; Eupatorium crithmifolium; Eupatorium pinnatifidum and 5 more. (GBIF Backbone)
WFO Plant List (2026-06) accepted. World Flora Online, CC0; read 2026-11-13.
Published in Phytologia 22: 111 (1971) (WCVP, RBG Kew, file of 2026-06-04)
Elsewhere Tropicos · Catalogue of Life · Flora of North America · Reflora · EOL · NCBI (identifiers from Wikidata's item Q21232466, read 2026-11-13, CC0)
Chromosomes no count in ChromoDB's IAPT/IOPB set (the file holds no count under IPNI id 1709-2). ChromoDB, IAPT/IOPB chromosome data (Simon, Bosch & Blanché), version 3.1 of 8 November 2026, CC BY 4.0; read 2026-11-13.
The record
Predicted extinction risk 10% probability of being threatened (95% interval 4% to 15%); predicted not threatened, the model is confident of this class. A model's prediction, not an assessment. Bachman et al. 2024, New Phytologist; Kew's data of 1 February 2024, CC BY 4.0; read 2026-11-13.
CITES Not in the CITES Appendices (the edition in force from 5 March 2026): no listing of its name, its genus or its family. CITES Appendices I, II and III, valid from 5 March 2026; read 2026-11-13. The Appendices
Every figure here is derived from public data by a stated rule and names its source; nothing about this species is written for its page by a person or by AI, apart from the marked, credited quotations. How →
Where this page came from built 2026-11-18
gbif.species answeredkept from this page's build of 2026-11-01gbif.synonyms answeredkept from this page's build of 2026-11-01gbif.vernacular answeredasked 2026-11-18names fetched 2026-10-21; carried by an offline re-derivation of 2026-11-18wcvp.distribution answeredas of 2026-06-04gbif.occurrences answeredas of 2026-10-21GBIF occurrence download https://doi.org/10.15468/dl.hbdw64, of 2026-10-21; 53 records at a dataset's default point left out (a coordinate where the records of 20 species or more of this reference lie, nearly all of them with no year, as the reference lists them; a record there its dataset states to within 10 km is kept); records tested against the native regions' shapes, openly licensed and restricted alike (Natural Earth's provinces, placed in TDWG's regions; shapes rule r87); a record within the margin, off a coast or on an island too small to draw counted only when it states the region's country, and only on no other region's land but within 0.02° of a native shape across a border, where its stated state or province does not name the other region (read by Natural Earth's name, its ISO 3166-2 code or an old province's name); 4 records within 1 km of a botanic garden, herbarium or zoo left out (3 at a botanic garden or arboretum, 1 at a zoo; Wikidata's list)climate answeredasked 2026-11-18climate.extremes answeredasked 2026-11-18NASA POWER (MERRA-2) daily 1981–2024, cell -34.50_-55.000, lapse-corrected -28 m at 6.5 °C/kmwikidata answeredkept from this page's build of 2026-10-21wikipedia nothing to reportkept from this page's build of 2026-10-21; not asked againinat.taxon answerediNaturalist's taxon 803124 (Acanthostyles buniifolius), kept from an earlier build, checked 2026-10-23: active and this species' own (kept from this page's build of 2026-10-21)inat.photos.wild answeredasked 2026-10-27from iNaturalist's API: research-grade observations not marked captive with an open-licence photograph, the observations iNaturalist puts first by votes, 24 of them (the open data of 2026-09-27 holds 122, and no votes); filled 2026-10-27; descendants read against Kew's file of 2026-06-04; kept by the build of 2026-11-18 (this build: not asked: this build left iNaturalist to the daily fill, which asks for the photographs once the page's taxon is known)inat.photos.cultivated nothing to reportobservations marked captive or cultivated whose identifications agree; filled 2026-10-27 (kept from this page's build of 2026-10-21)gbif.media answeredas of 2026-10-21from the GBIF download https://doi.org/10.15468/dl.hbdw64, of 2026-10-21commons not askedkept from this page's build of 2026-10-29openalex not askedthe reference does not ask OpenAlex for papersEvery source is recorded as having answered, reported nothing, refused, failed, not been asked, or answered twice where one answer is taken (“not taken: two items answered”), and, for a source asked when this page was built, when: the figures are as the source held them that day; a source read from a file (Kew's World Checklist, a GBIF download) says "as of" the file's day instead; a row carried from an earlier build of the page names that build instead. Only “nothing to report” is ever shown as an absence. Records came from 35 datasets via GBIF.org; each carries its own licence.