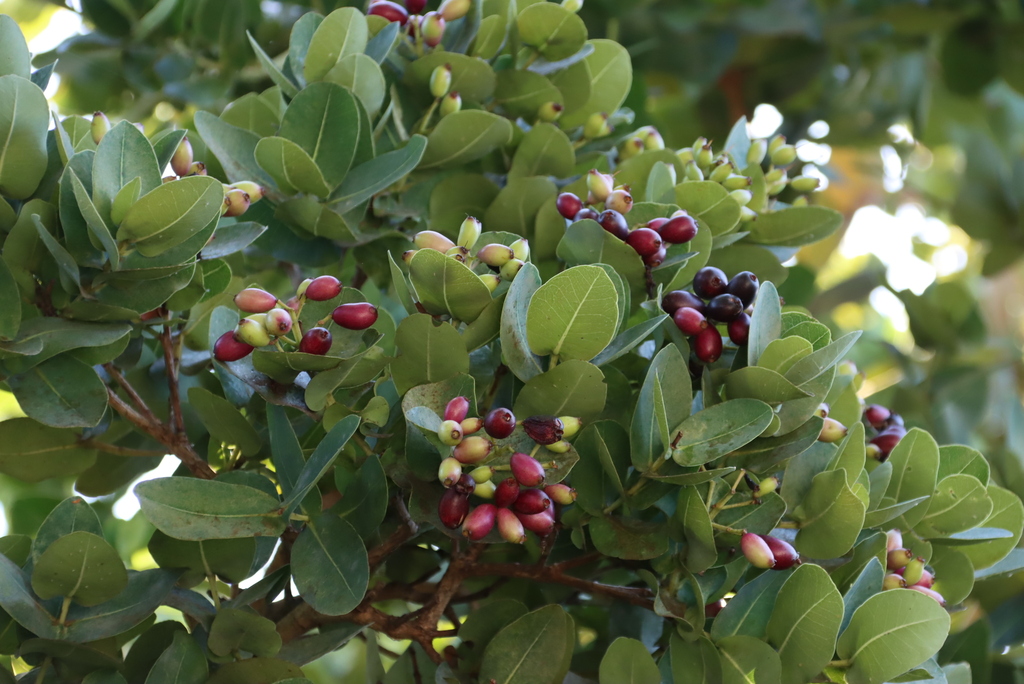
Syzygium cordatum Hochst.
Mohlo, Montlho, Umdoni Waterberry, Water Berry
Every figure on this page is derived from public data by a stated rule and says its source; nothing here is written by a person or a model, except the Wikipedia passage, which is quoted and marked as such. How it is made.
Summary
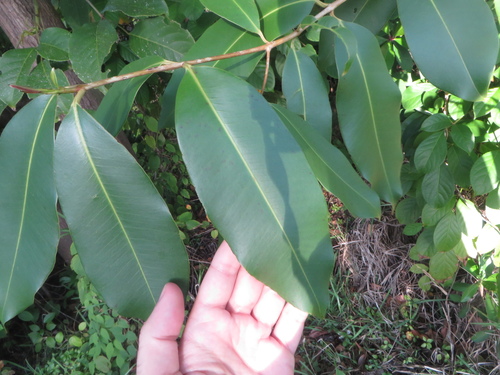
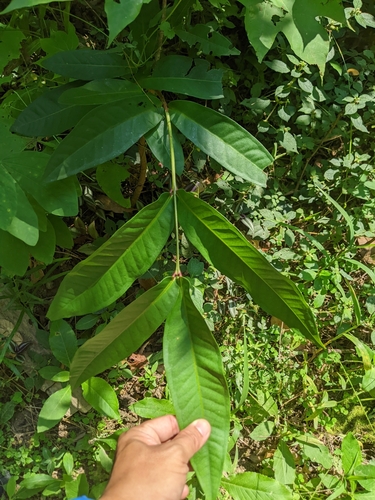
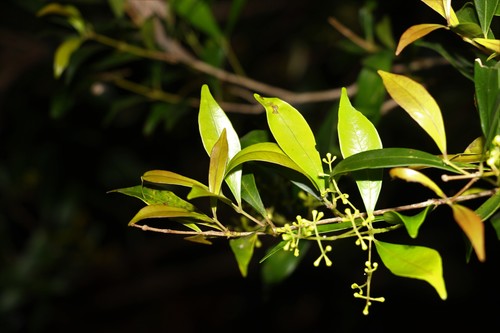
Syzygium cordatum is an evergreen, water-loving tree, which grows to a height of 8–15 m. This tree is often found near streams, on forest margins or in swampy spots. The leaves are elliptic to circular, bluish green on top and a paler green below. Young leaves are reddish. More on Wikipedia ›
The opening of Wikipedia, “Syzygium cordatum”, CC BY-SA 4.0, quoted as written. Kept separate from everything derived here.
About the genus · Syzygium
Syzygium is a genus of flowering plants that belongs to the myrtle family, Myrtaceae. The genus comprises about 1200 species, and has a native range that extends from Africa and Madagascar through southern Asia east through the Pacific. Its highest levels of diversity occur from Malaysia to northeastern Australia, where many species are very poorly known and many more have not been described taxonomically. More on Wikipedia ›
The opening of Wikipedia, “Syzygium”, CC BY-SA 4.0, quoted as written.
At a glance
Cultivation
Its year Rain rule: a summer growing season, April to September in the northern hemisphere (October to March at the habitat, southern).
This species’ habitat figures, and what two fixed rules read from them.
The rain rule reads a summer growing season: 70% of the year's rain (699 mm of 940 mm) falls in October to March, warmer than the year (wet-season mean 21.2 °C against a yearly mean of 19.2 °C). Months are the habitat's, southern hemisphere; shifted six months for a northern-hemisphere collection: April to September.
Read from the median year of CHELSA monthly rainfall and mean temperature across the envelope cells: the rain rule takes the smallest set of months carrying 70% of the rain and calls it winter when its mean is more than half a degree below the year's, summer when more than that above, and neither in between; the temperature rule, used only under 120 mm, names the cooler six months when they are at least a degree cooler than the other six. Months are shifted for the other hemisphere only where the temperature curve gives a season to reverse. A reading of the curves, not an observation of the plant.
Rain Habitat rain 940 mm a year, wettest January at 137 mm, driest June at 26 mm (habitat calendar, southern hemisphere).
This species’ habitat figures, with their source.
940 mm a year at the habitat, 699 mm of it October to March. Wettest month January at 137 mm, driest June at 26 mm. Across the envelope cells the year's total runs 680 mm to 1433 mm (10th to 90th percentile of each cell's own year) (median year across the envelope cells, CHELSA; habitat calendar, southern hemisphere).
CHELSA monthly precipitation, median year across the envelope cells. The rain that falls where the species is recorded; nothing about how the plant takes water.
Light Open sky over the habitat: 22 to 38 mol/m²/day.
This species’ habitat figures, with their source.
Open sky over the habitat: 22 to 38 mol/m²/day across the year (daily light integral, median year across the envelope cells, CHELSA; the lowest 10th-percentile month across the cells is 17, the highest 90th-percentile month 49).
CHELSA shortwave radiation at each envelope cell, a daily-mean flux taken to a daily total and converted at 2.07 mol of PAR per MJ. The sky over the habitat, measured; what reaches a plant under a rock, a shrub or a shade cloth is not.
Warmth and air Cold floor 8.3 °C (1st-percentile habitat night, NASA POWER).
This species’ habitat figures, with their source.
Coldest: the 1st-percentile night over 44 years at the typical cell is 8.3 °C, the absolute minimum 4.7 °C, no frost in 44 years (NASA POWER daily minima). Warmest: the 99th-percentile day is 40.9 °C. Monthly means: coldest night 10.6 °C in July (across the envelope cells 5.2 °C to 16.0 °C), warmest day 25.9 °C in February (median year across the envelope cells, CHELSA). Cold floor: 8.3 °C, which is the 1st-percentile night over 44 years at the typical cell (NASA POWER).
NASA POWER daily minima and maxima 1981–2024 at the typical cell, lapse-corrected to its elevation; CHELSA monthly means, median year across the envelope cells, CHELSA. The cold floor is the figure named in its sentence. Not a measured survival limit for any plant in a pot.
Relative humidity at the habitat: 56 to 64% across the year (monthly means, median year across the envelope cells, CHELSA). A figure about the air, saying nothing about how the plant takes water.
CHELSA relative humidity, median year across the envelope cells.
The figures the cards read from are in Climate below, and where they came from in Natural habitat.
Climate across the habitat
Figures by month
| Jan | Feb | Mar | Apr | May | Jun | Jul | Aug | Sep | Oct | Nov | Dec | |
|---|---|---|---|---|---|---|---|---|---|---|---|---|
| Day °C | 26 / 23–29 | 26 / 23–29 | 25 / 22–28 | 24 / 21–27 | 23 / 19–25 | 21 / 17–24 | 21 / 16–24 | 22 / 17–26 | 23 / 18–27 | 23 / 20–28 | 24 / 21–28 | 25 / 22–28 |
| Night °C | 18 / 15–23 | 18 / 15–23 | 17 / 14–22 | 16 / 12–20 | 13 / 9–19 | 11 / 6–16 | 11 / 5–16 | 11 / 7–17 | 13 / 9–18 | 15 / 11–19 | 16 / 13–20 | 17 / 14–22 |
| Rain mm | 137 / 47–235 | 125 / 41–221 | 107 / 60–187 | 67 / 38–166 | 39 / 12–130 | 26 / 5–109 | 29 / 3–111 | 35 / 4–96 | 45 / 10–98 | 87 / 35–123 | 119 / 61–159 | 124 / 59–206 |
| DLI | 38 / 34–49 | 37 / 34–44 | 33 / 31–38 | 28 / 26–34 | 25 / 20–32 | 22 / 17–32 | 23 / 18–32 | 27 / 23–36 | 32 / 29–41 | 35 / 31–42 | 37 / 34–46 | 38 / 35–49 |
| RH % | 64 / 58–68 | 64 / 58–67 | 63 / 58–67 | 62 / 57–65 | 59 / 53–62 | 56 / 51–61 | 56 / 49–61 | 57 / 48–61 | 60 / 48–62 | 61 / 52–65 | 62 / 55–65 | 63 / 57–67 |
Each figure is the median across the 812 grid cells holding the 1654 in-range records, with the 10th–90th percentile span across those cells after the slash where it differs. Extremes and elevation were read at the typical cell 2254:4218 (-22.725, 30.925). Over 44 years there: absolute minimum 4.7 °C, 1st-percentile night 8.3 °C, 99th-percentile day 40.9 °C. Normals: CHELSA V2.1 1981–2010 climatology, 0.05° cells (each the mean of ~36 1 km pixels). Envelope: median and 10th–90th percentile of each month across the 812 distinct grid cells holding the 1654 in-range records; extremes and elevation at the typical cell 2254:4218 (its coldest month's mean night nearest the median across cells); its position is the cell centre. Extremes: NASA POWER (MERRA-2) daily 1981–2024, cell -22.50_30.625, lapse-corrected -23 m at 6.5 °C/km. Elevation: ETOPO 2022, 507 m (cell mean).
Natural habitat
Photographs
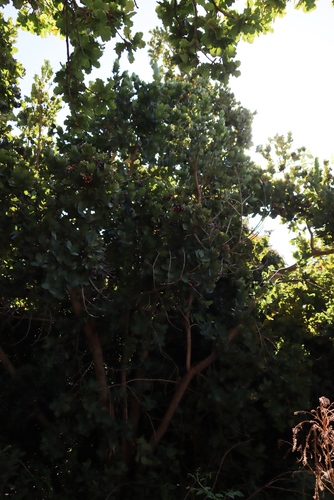
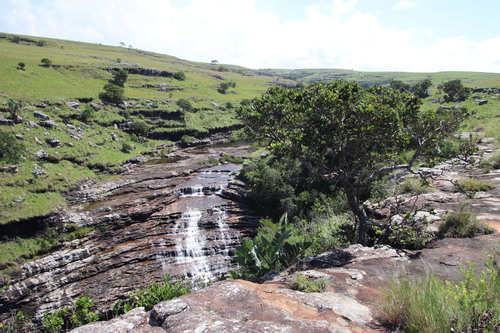
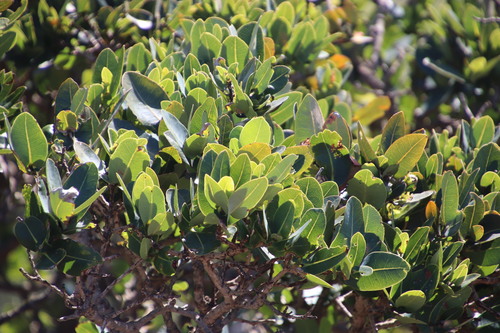
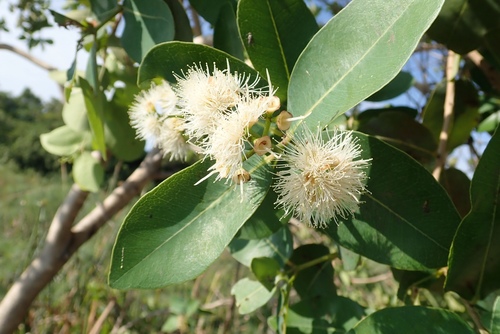
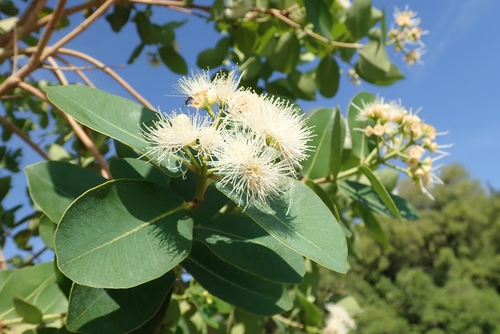
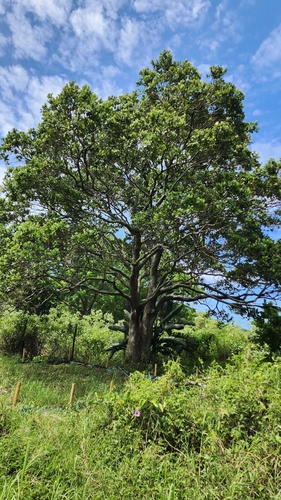
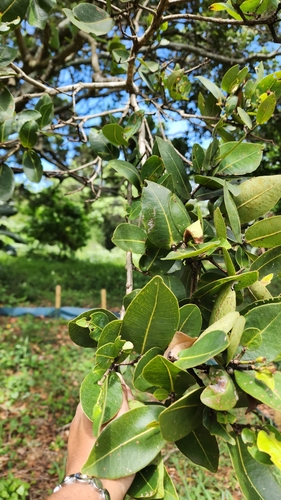
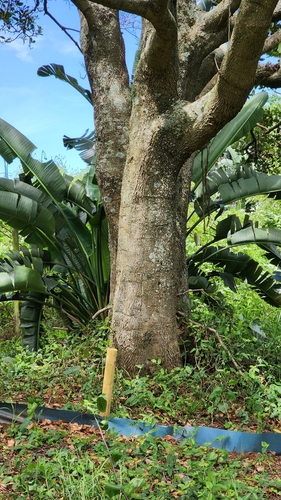
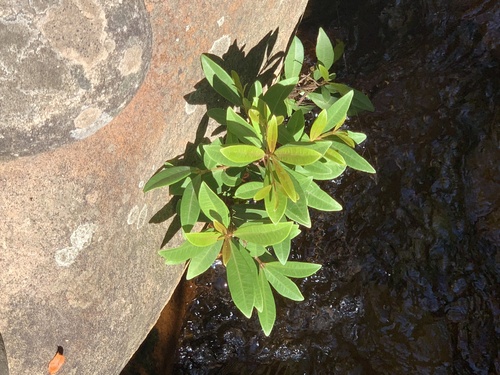
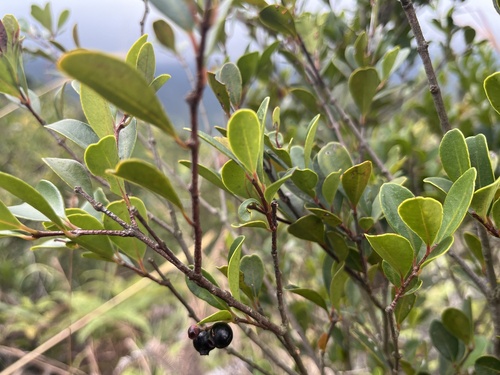
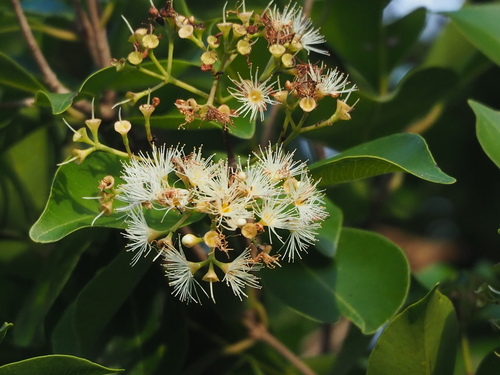
Photographs: (c) Tony Rebelo, some rights reserved (CC BY-SA) (3); (c) Robert Taylor, some rights reserved (CC BY) (2); (c) Suvarna Parbhoo Mohan, some rights reserved (CC BY-SA) (3).
Photographs: iNaturalist did not answer when this page was built; what is shown came from the sources that did.
Papers naming this species
Works whose title or abstract names Syzygium cordatum, most cited first, from OpenAlex (CC0). A mention, not a cultivation source: nothing on this page is drawn from them.
Related
Similar habitat climate the 6 species whose habitat climate is nearest this one's: mean day and night, month by month, and rain on a log scale, in calendar order, so a habitat with the same seasons six months out is far, not near. Nothing else counts: not range, not family.
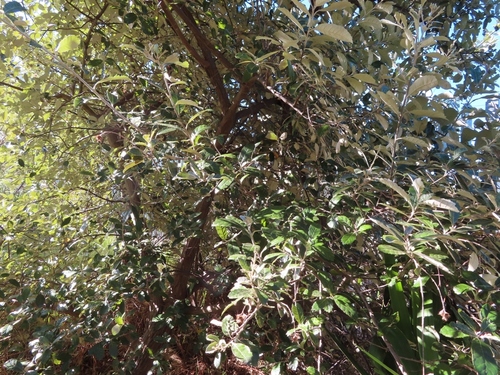 Brachylaena discolor Coast Silver Oak
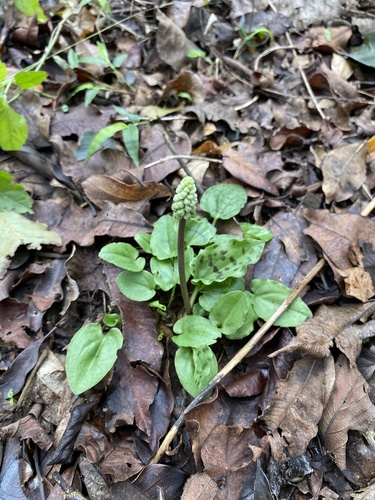 Drimiopsis maculata African false hosta
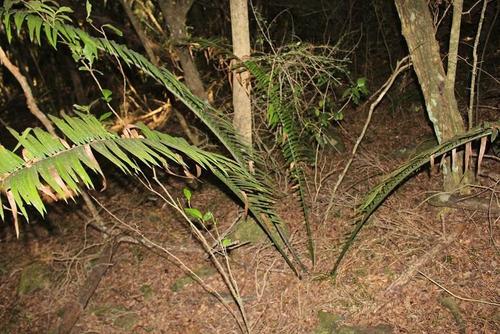 Encephalartos villosus Ground Cycad
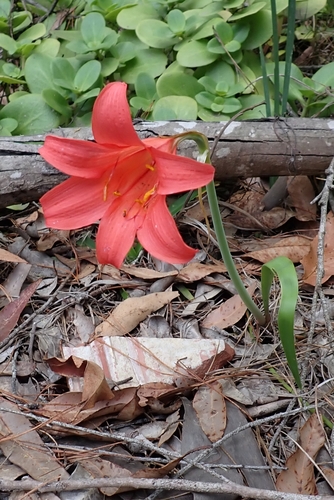 Cyrtanthus sanguineus Blood Firelily
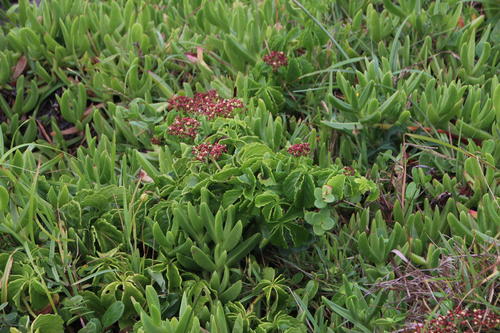 Cyphostemma cirrhosum Pucker Grape
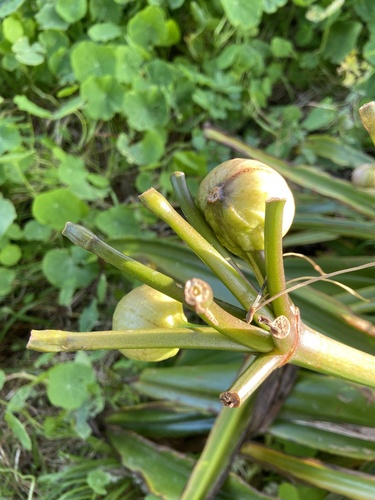 Clivia miniata Amaryllidaceae
Other Syzygium 11 in the reference
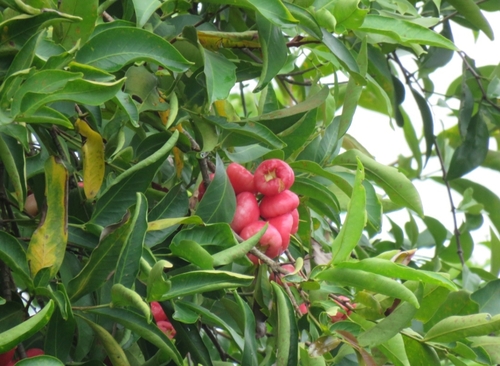 Syzygium aqueum Bell Fruit
 Syzygium australe Australian brush-cherry
 Syzygium buxifolium boxleaf eugenia
 Syzygium cumini Black Plum
 Syzygium formosanum Myrtaceae
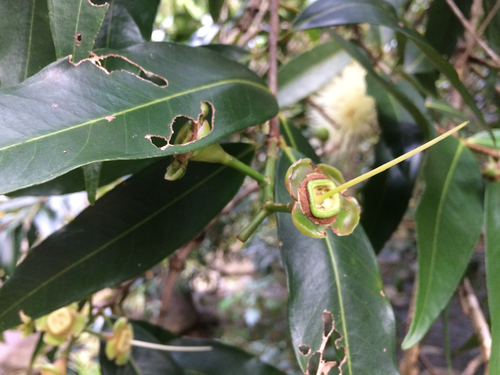 Syzygium jambos Jambos
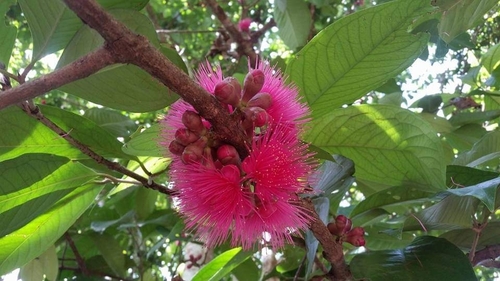 Syzygium malaccense Malay-apple
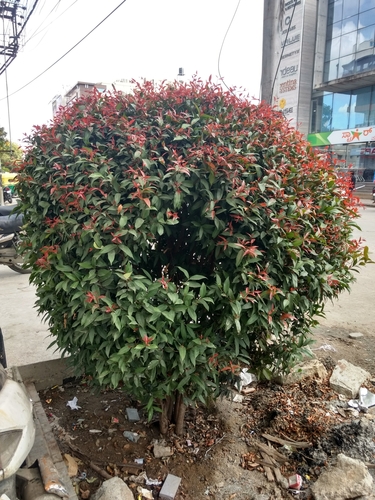 Syzygium myrtifolium Red Lip
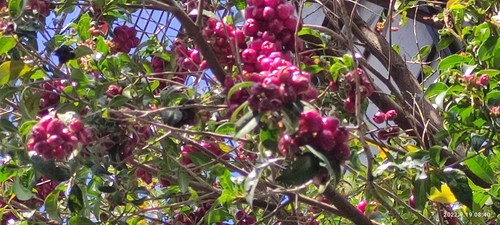 Syzygium paniculatum brush cherry
 Syzygium samarangense Java-apple
 Syzygium smithii Lilly Pilly
 History & registers
Where this page came from built 2026-09-20 · dossier v2 · node
gbif.species answeredcarried from build of 2026-09-19 (offline re-derivation; the backbone was not asked)gbif.synonyms answeredcarried from build of 2026-09-19 (offline re-derivation; the backbone was not asked)gbif.vernacular answeredcarried from build of 2026-09-19 (offline re-derivation; the backbone was not asked)wcvp.distribution answeredgbif.occurrences answeredGBIF occurrence download https://doi.org/10.15468/dl.3h4zamclimate answeredwikidata answeredcarried from build of 2026-09-19 (rederive); that build: carried from build of 2026-09-19 (rederive)wikipedia answeredcarried from build of 2026-09-19; this build: skippedinat.taxon not askedinat.photos.wild answeredcarried from build of 2026-09-19; this build: skippedinat.photos.cultivated nothing to reportcarried from build of 2026-09-19 (rederive); that build: filled 2026-09-20commons nothing to reportcarried from build of 2026-09-19 (rederive); that build: carried from build of 2026-09-19 (rederive)gbif.media answeredopenalex answeredcarried from build of 2026-09-19; this build: skippedEvery upstream is recorded as having answered, reported nothing, or refused. Only “nothing to report” is ever shown as an absence. Records came from 37 datasets via GBIF.org; each carries its own licence.